ANALYSIS
INTRODUCTION
Introduction to Analysis using the HSEA model
Vehicle Diagnostics
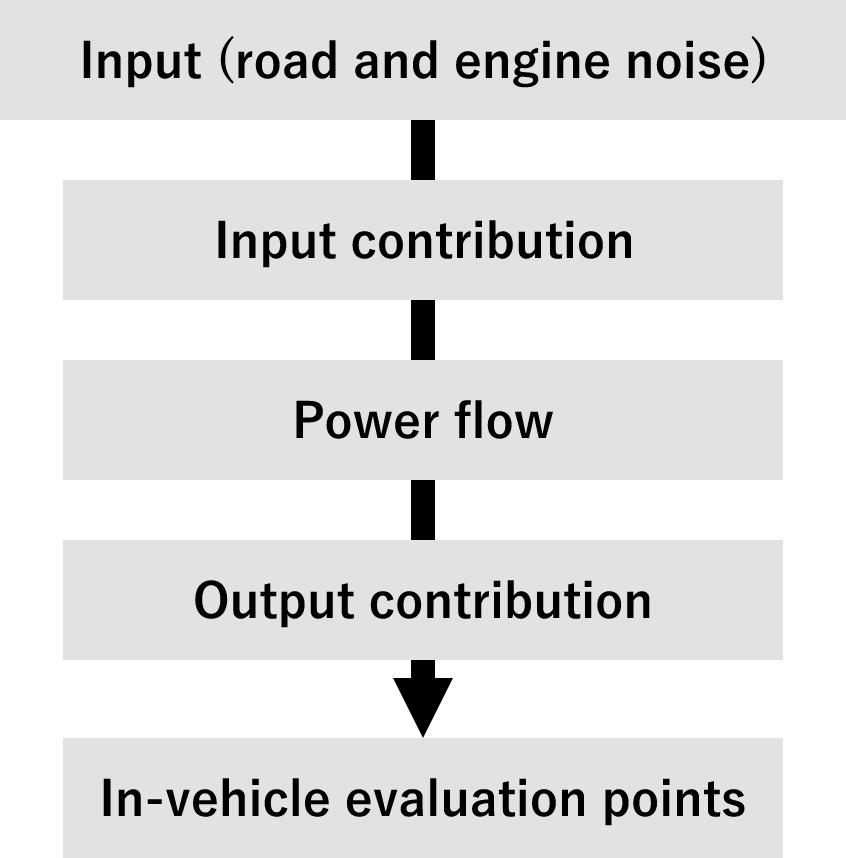
Input contribution
Visualization of the Input origin whether it is vibration or acoustic contribution, and what is the main contributor.
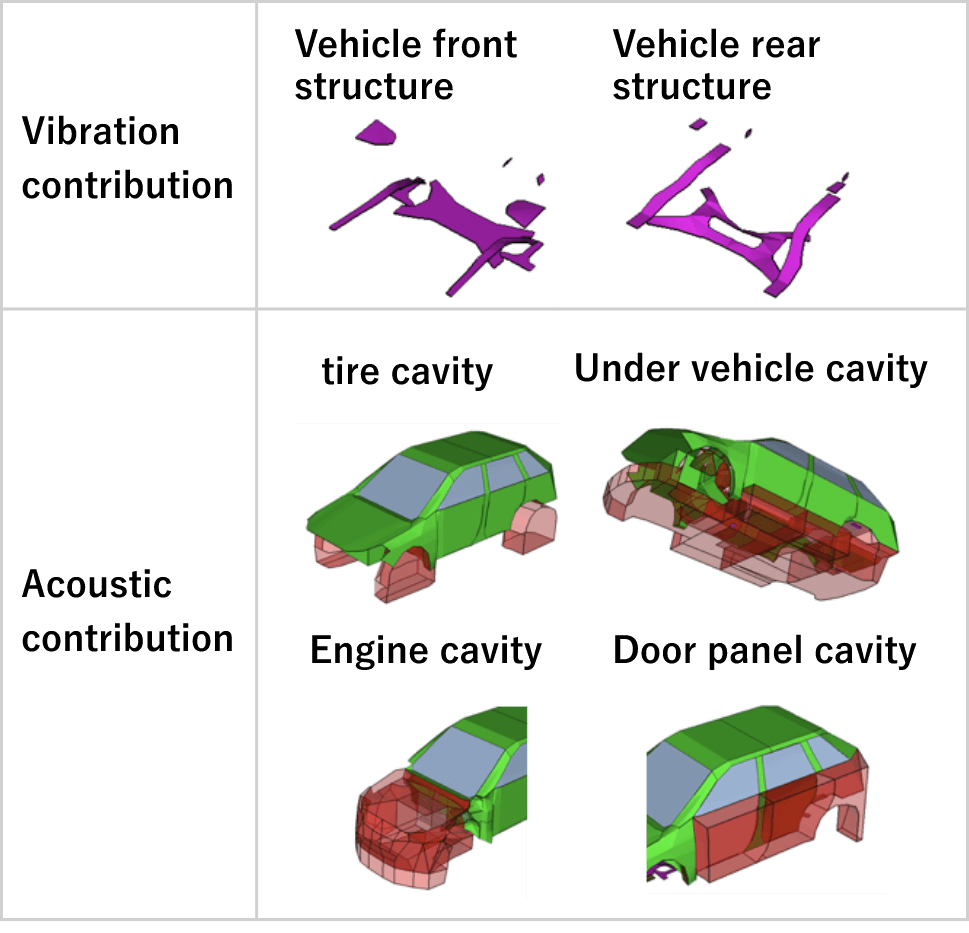
Above the red line: acoustic contribution
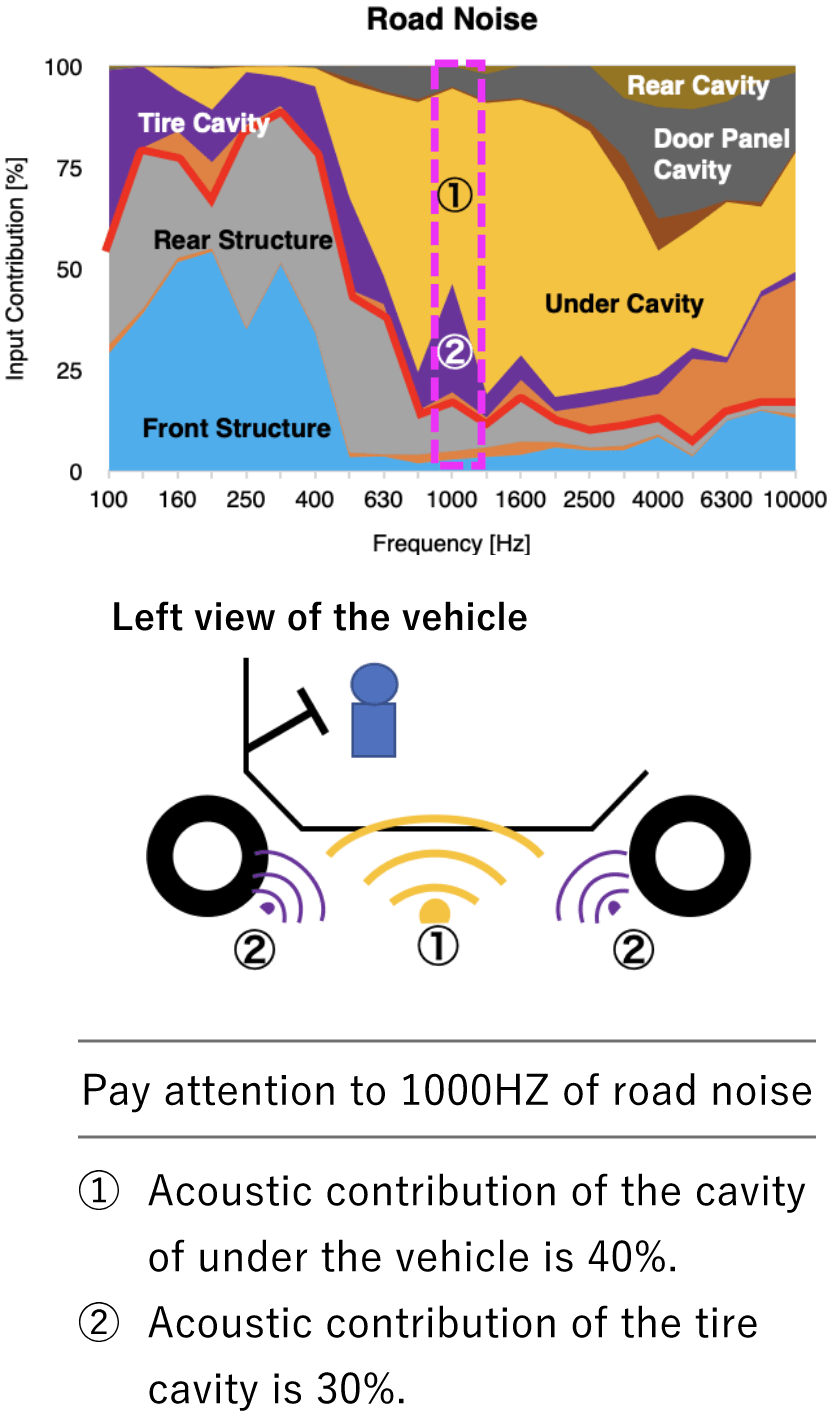
Below the red line: vibration contribution
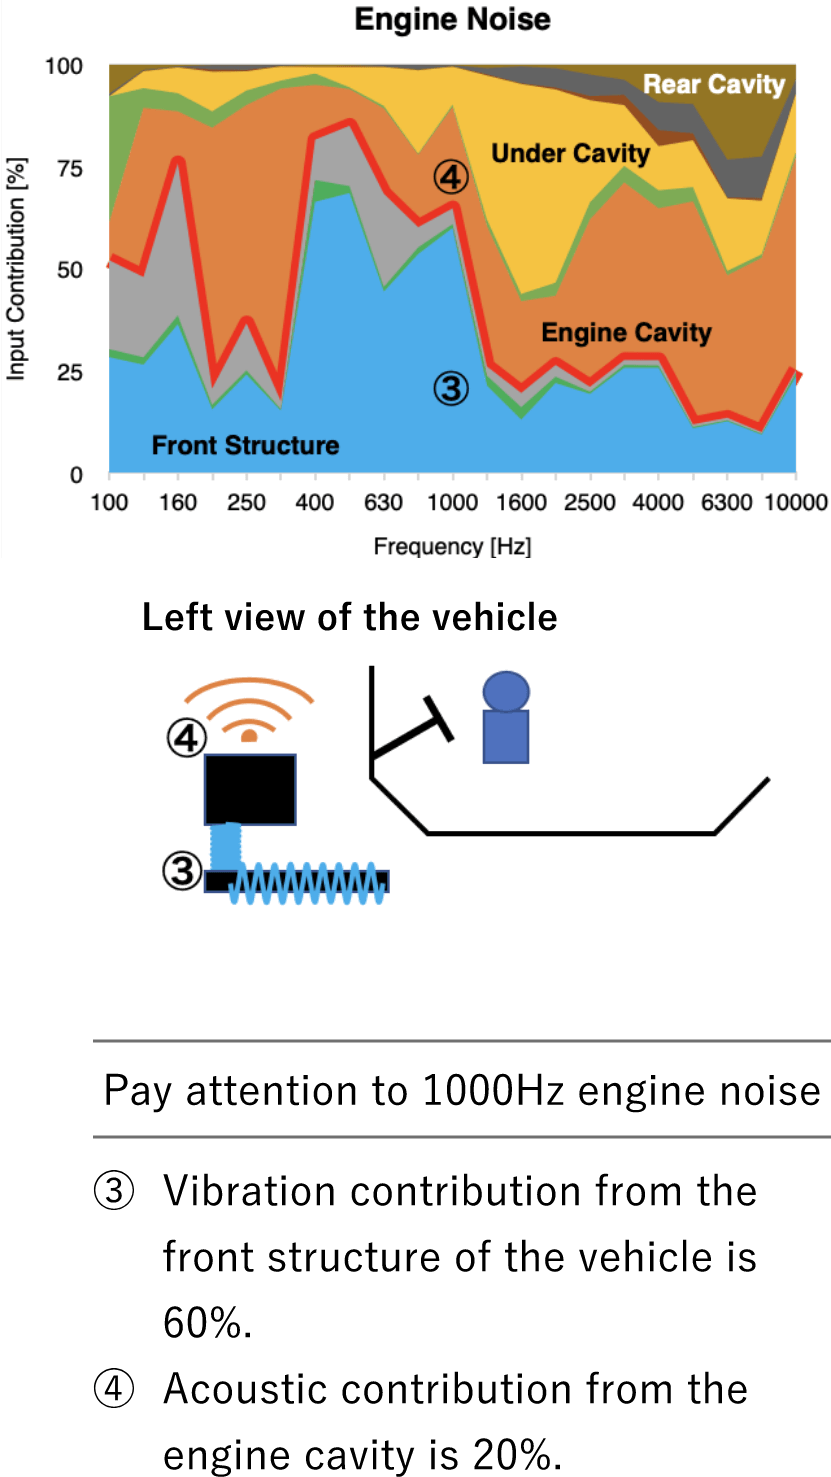
Above the red line: acoustic contribution / Below the red line: vibration contribution
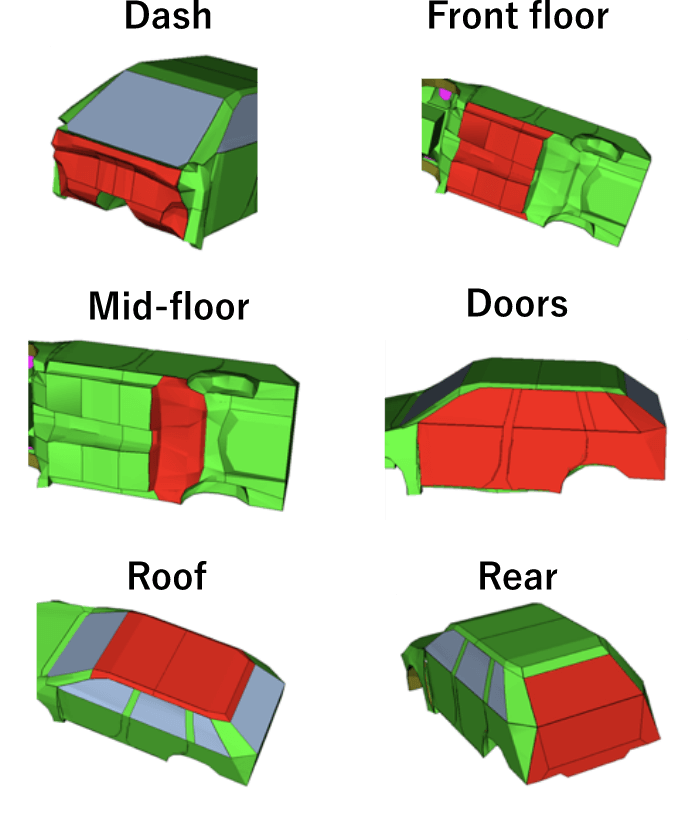
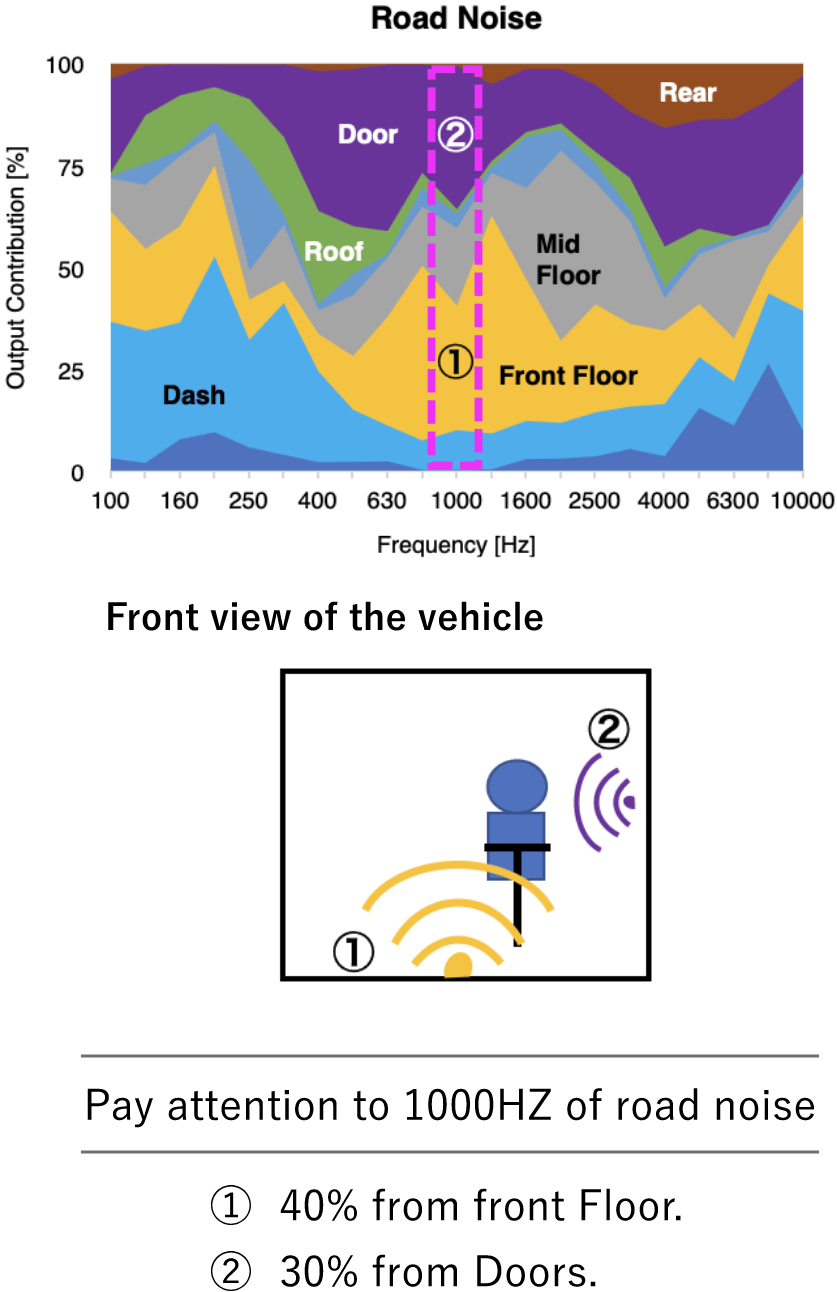
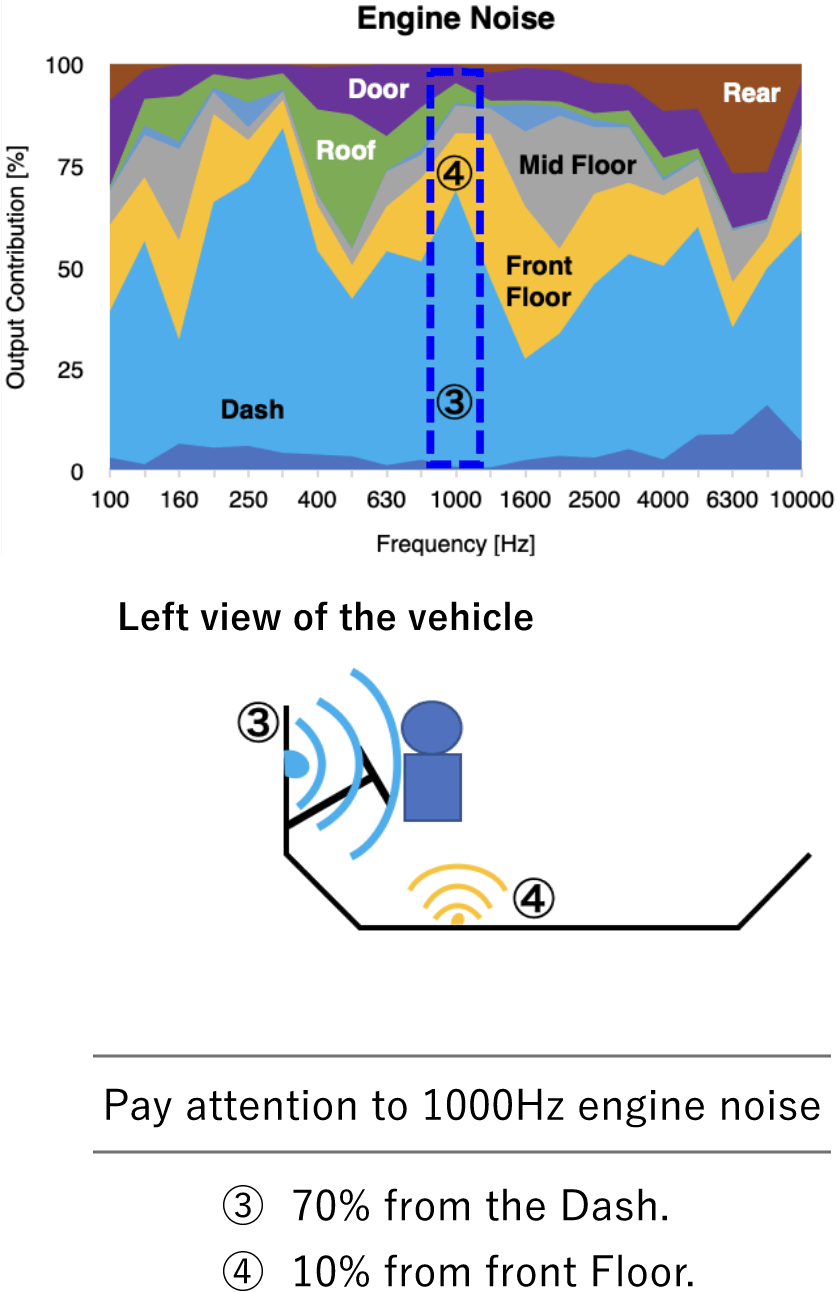
Output contribution
Visualization of where the sound can be heard in the car, and determine effective countermeasure areas.
Power flow
Visualization of where the sound can be heard in the car, and determine effective countermeasure areas.
Main Power flow of engine noise (315Hz)
scroll▶︎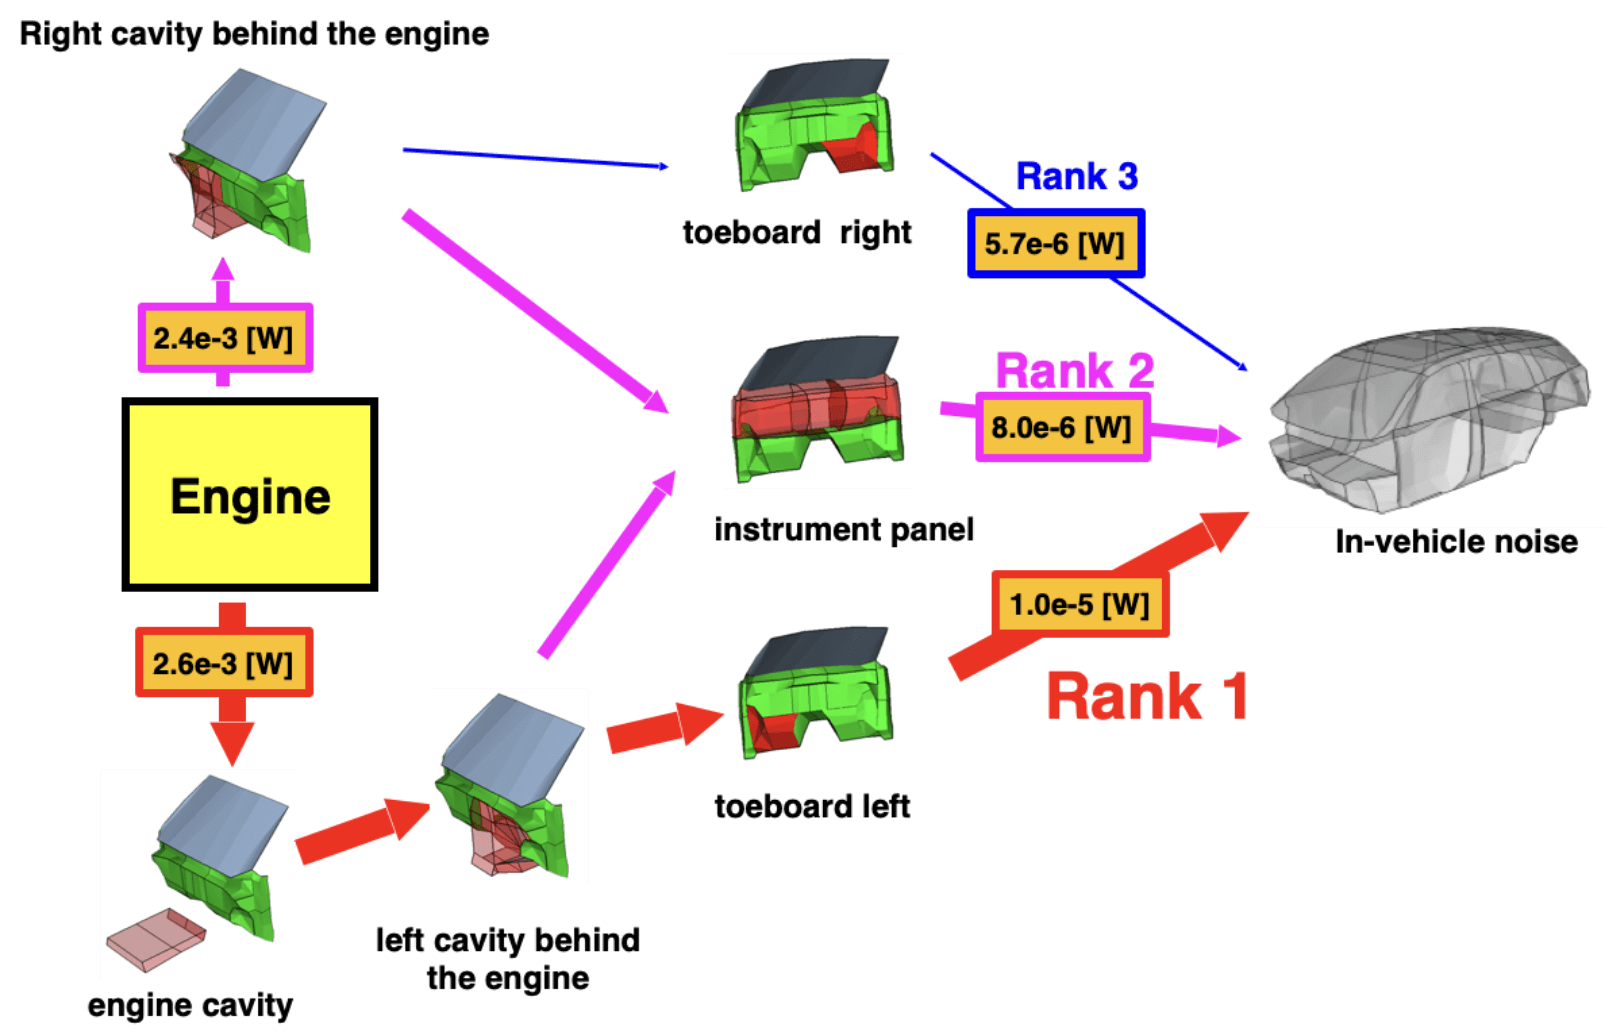
Energy Transmission Loss(ETL)
An evaluation metric for the performance of reducing the sound of a speaker excited in the sound source cavity before it reaches the sound receiving cavity.
Dismantle the vehicle into about 25 systems and evaluate their performance


Investigation of soundproof
materials performance
The performance of each soundproof material can be evaluated because information on soundproof materials is set.
It is possible to evaluate the Insertion loss and the Absorption coefficient:α,etc. of the soundproof materials because detailed material information is also set.

