ONSITE
TECHNICAL SUPPORT
Vehicle Diagnostics
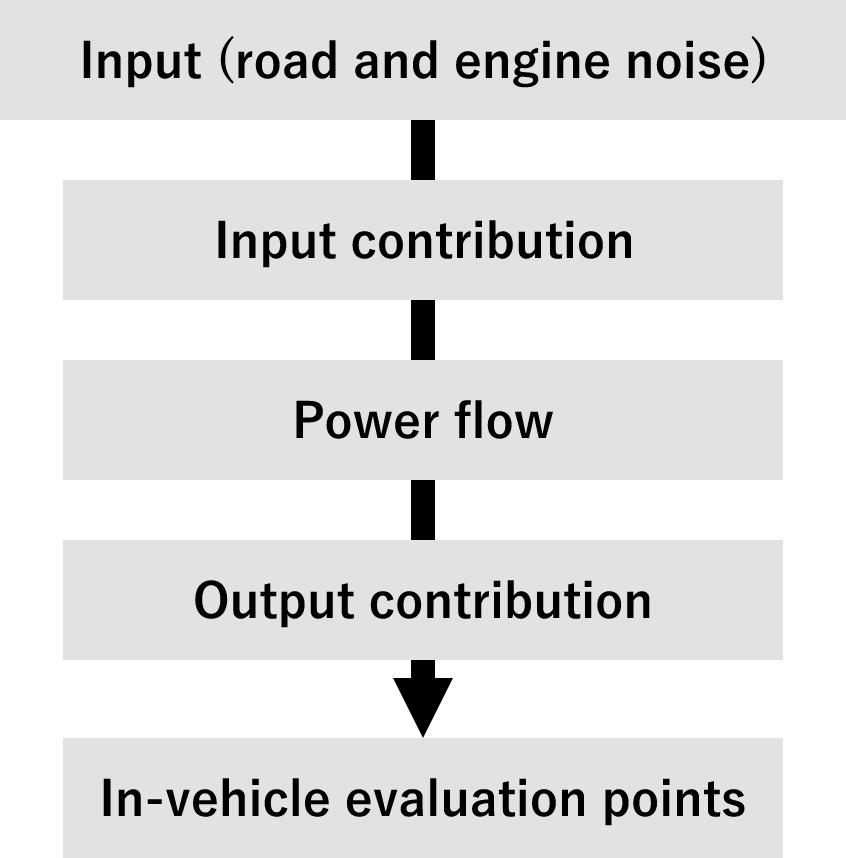
Input contribution
Visualization of the Input origin whether it is vibration or acoustic contribution, and what is the main contributor.
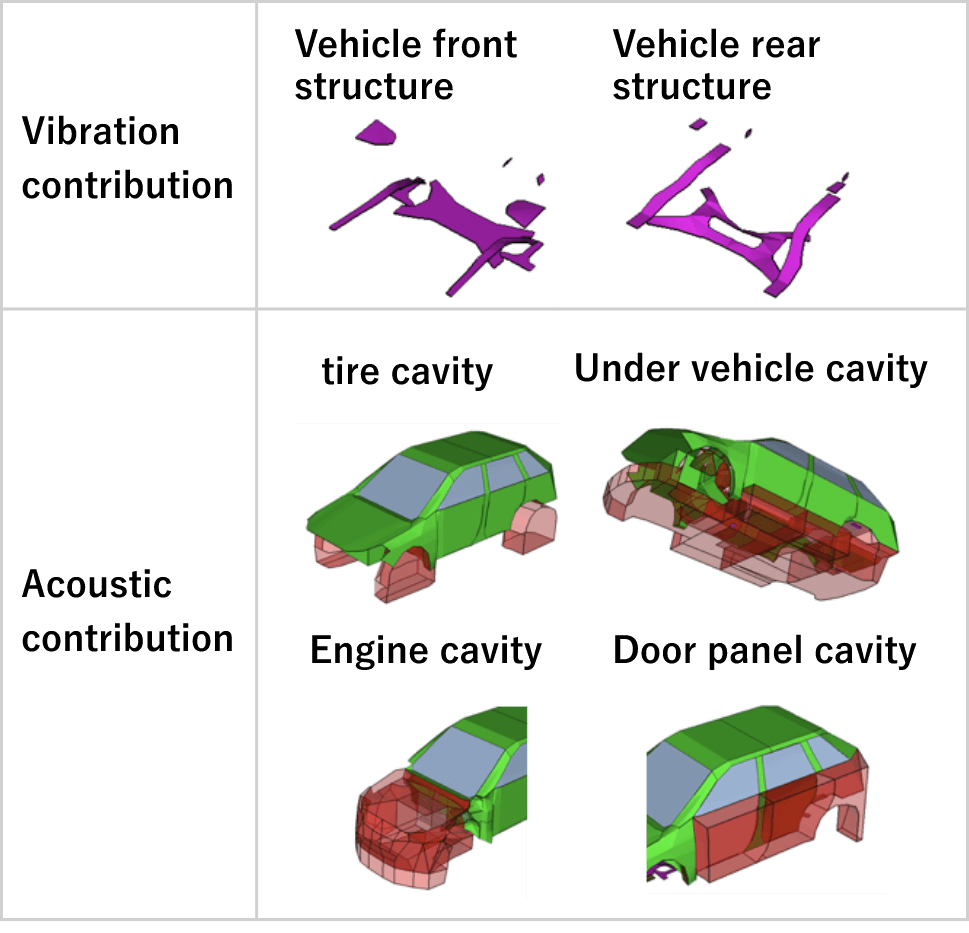
Above the red line: acoustic contribution
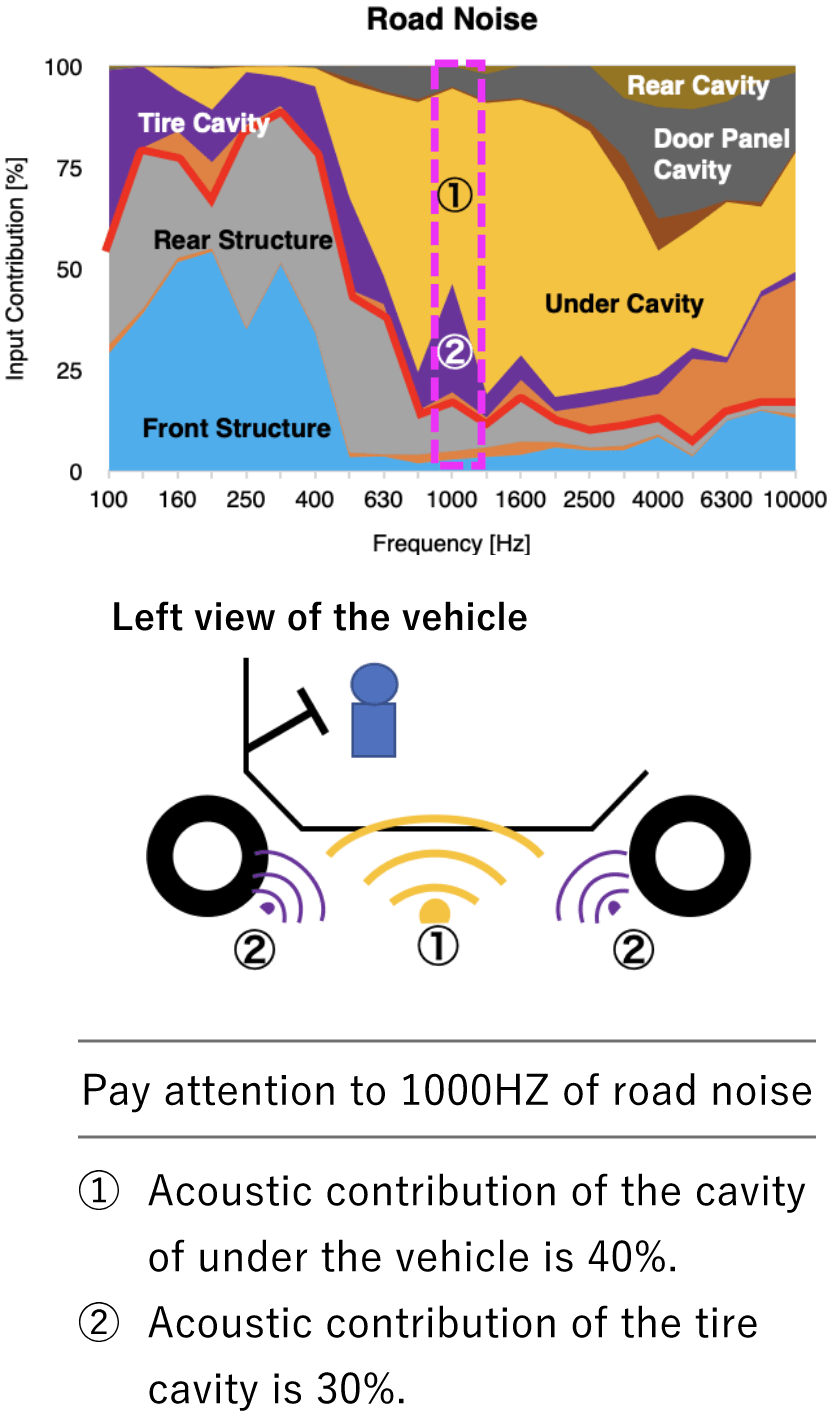
Below the red line: vibration contribution
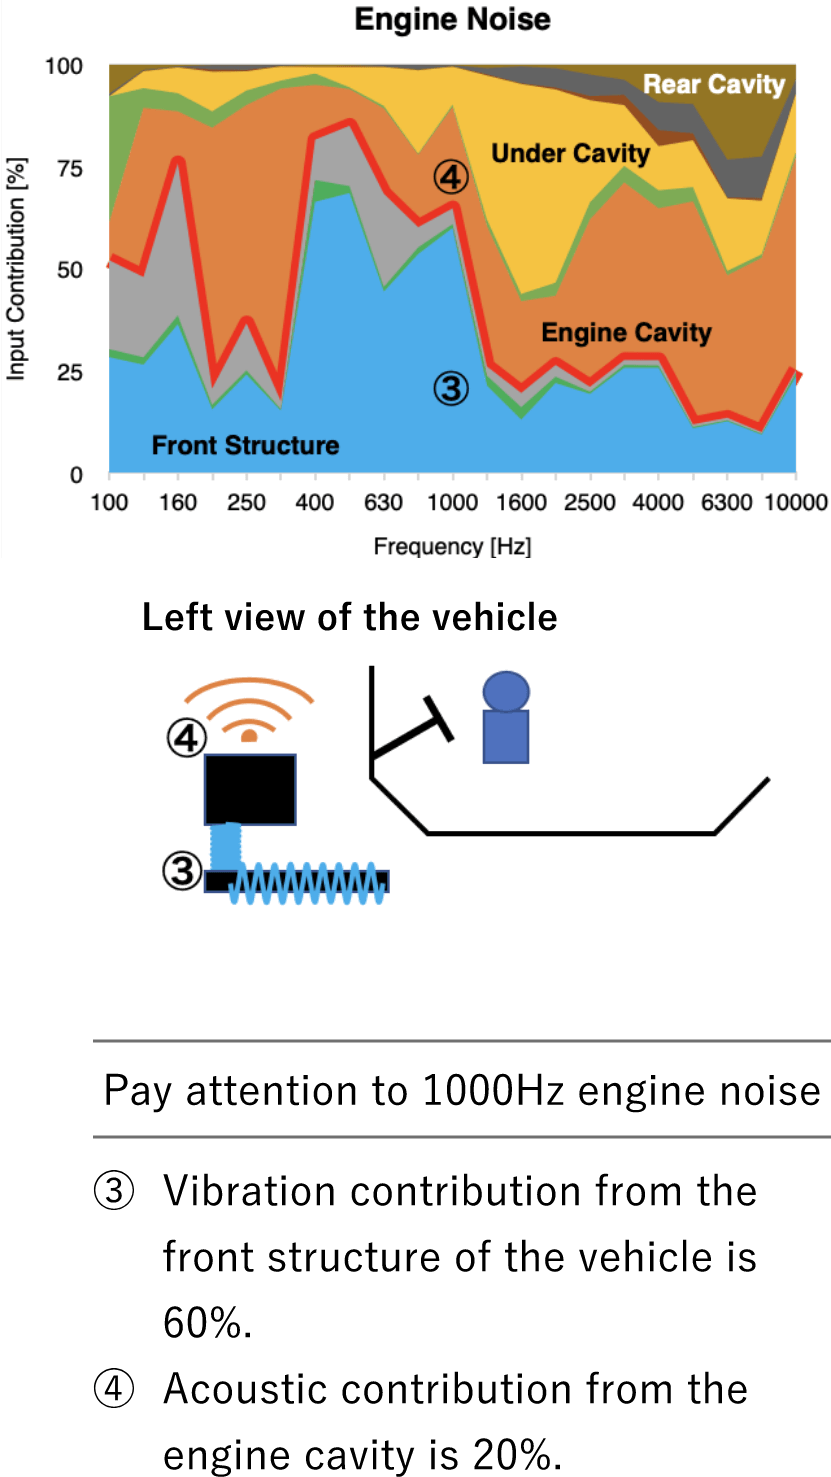
Above the red line: acoustic contribution / Below the red line: vibration contribution
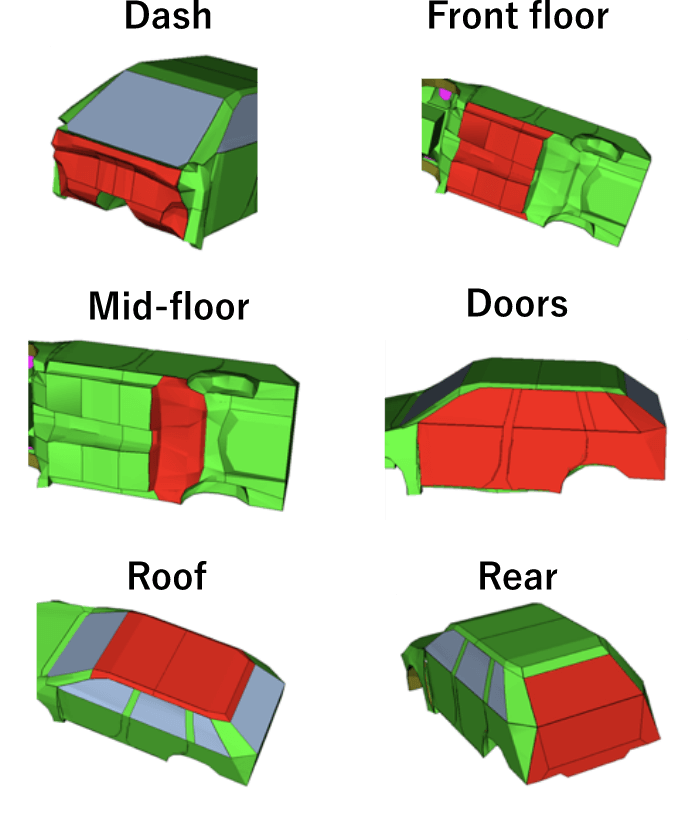
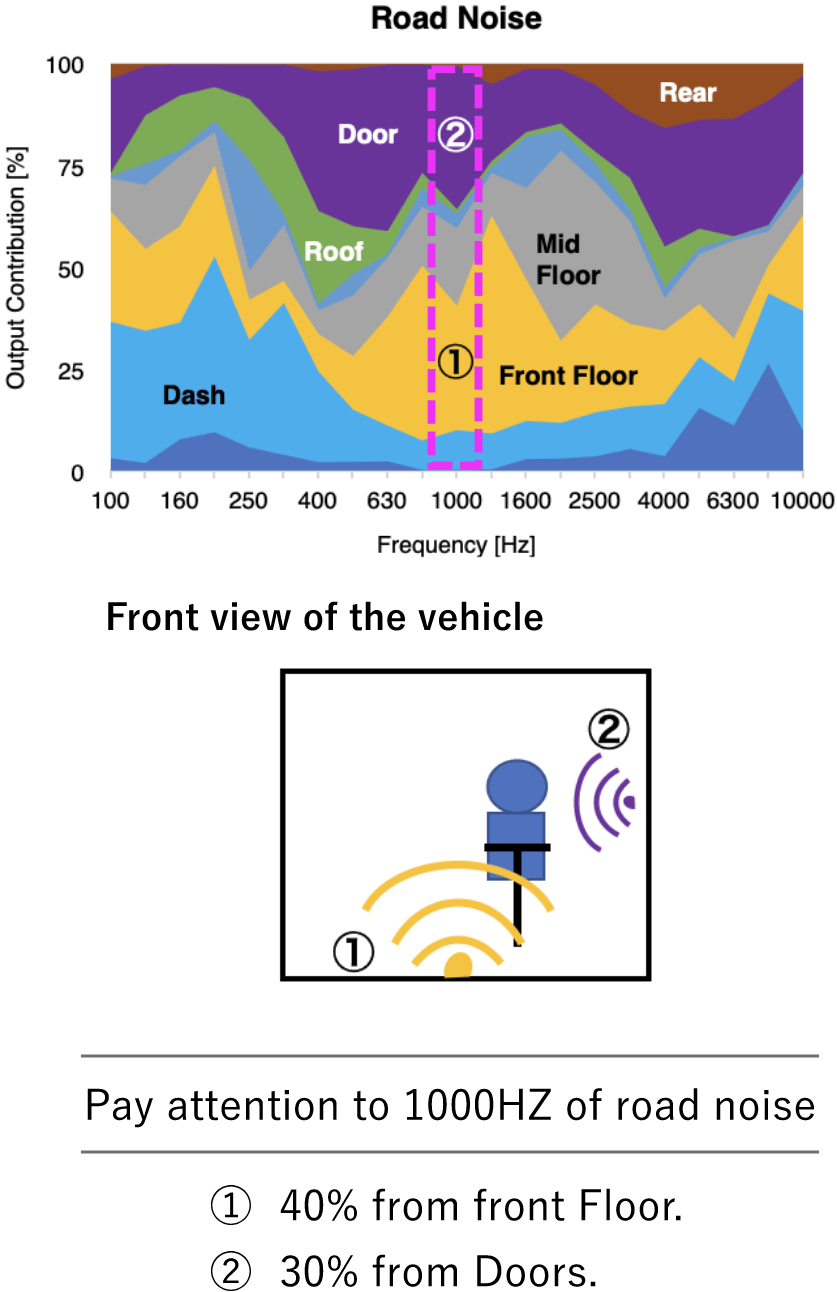
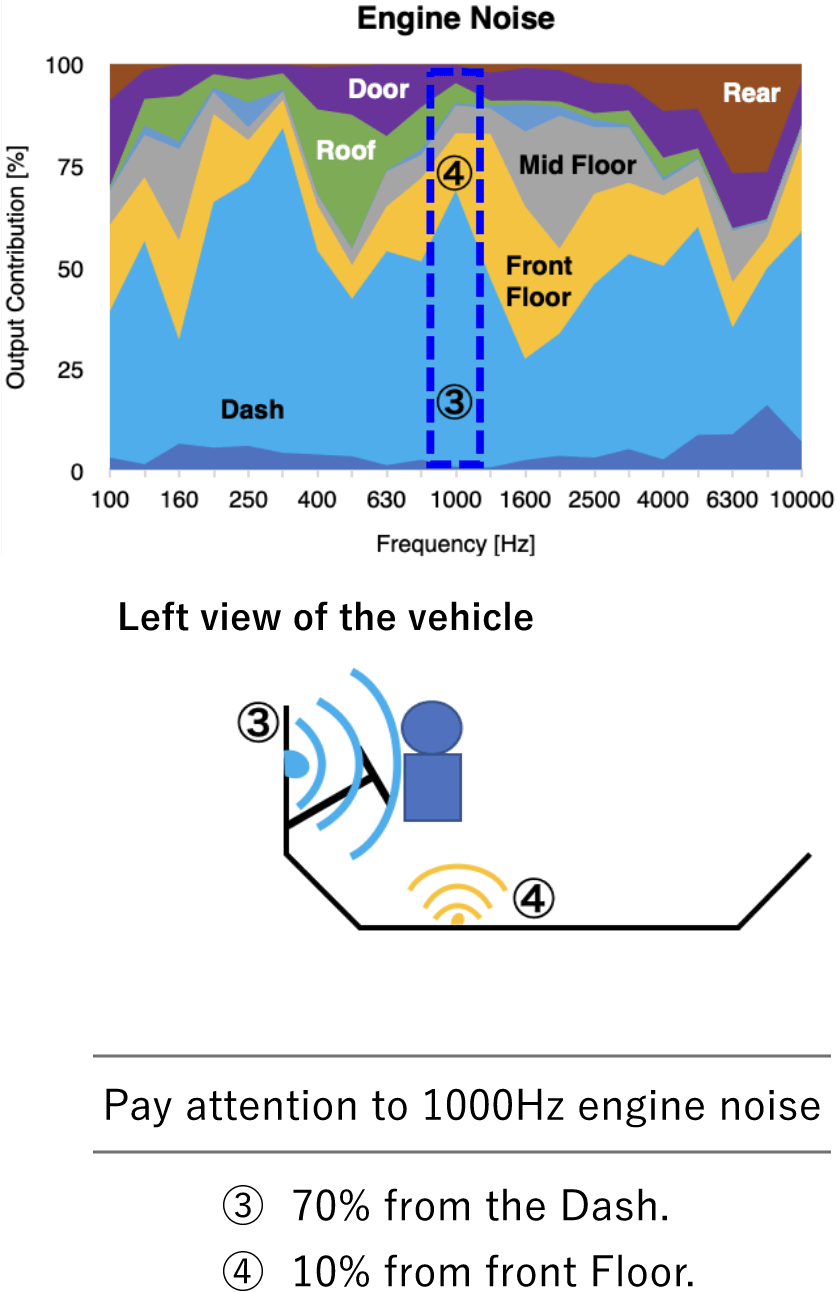
Output contribution
Visualization of where the sound can be heard in the car, and determine effective countermeasure areas.
Power flow
Visualization of where the sound can be heard in the car, and determine effective countermeasure areas.
Main Power flow of engine noise (315Hz)
scroll▶︎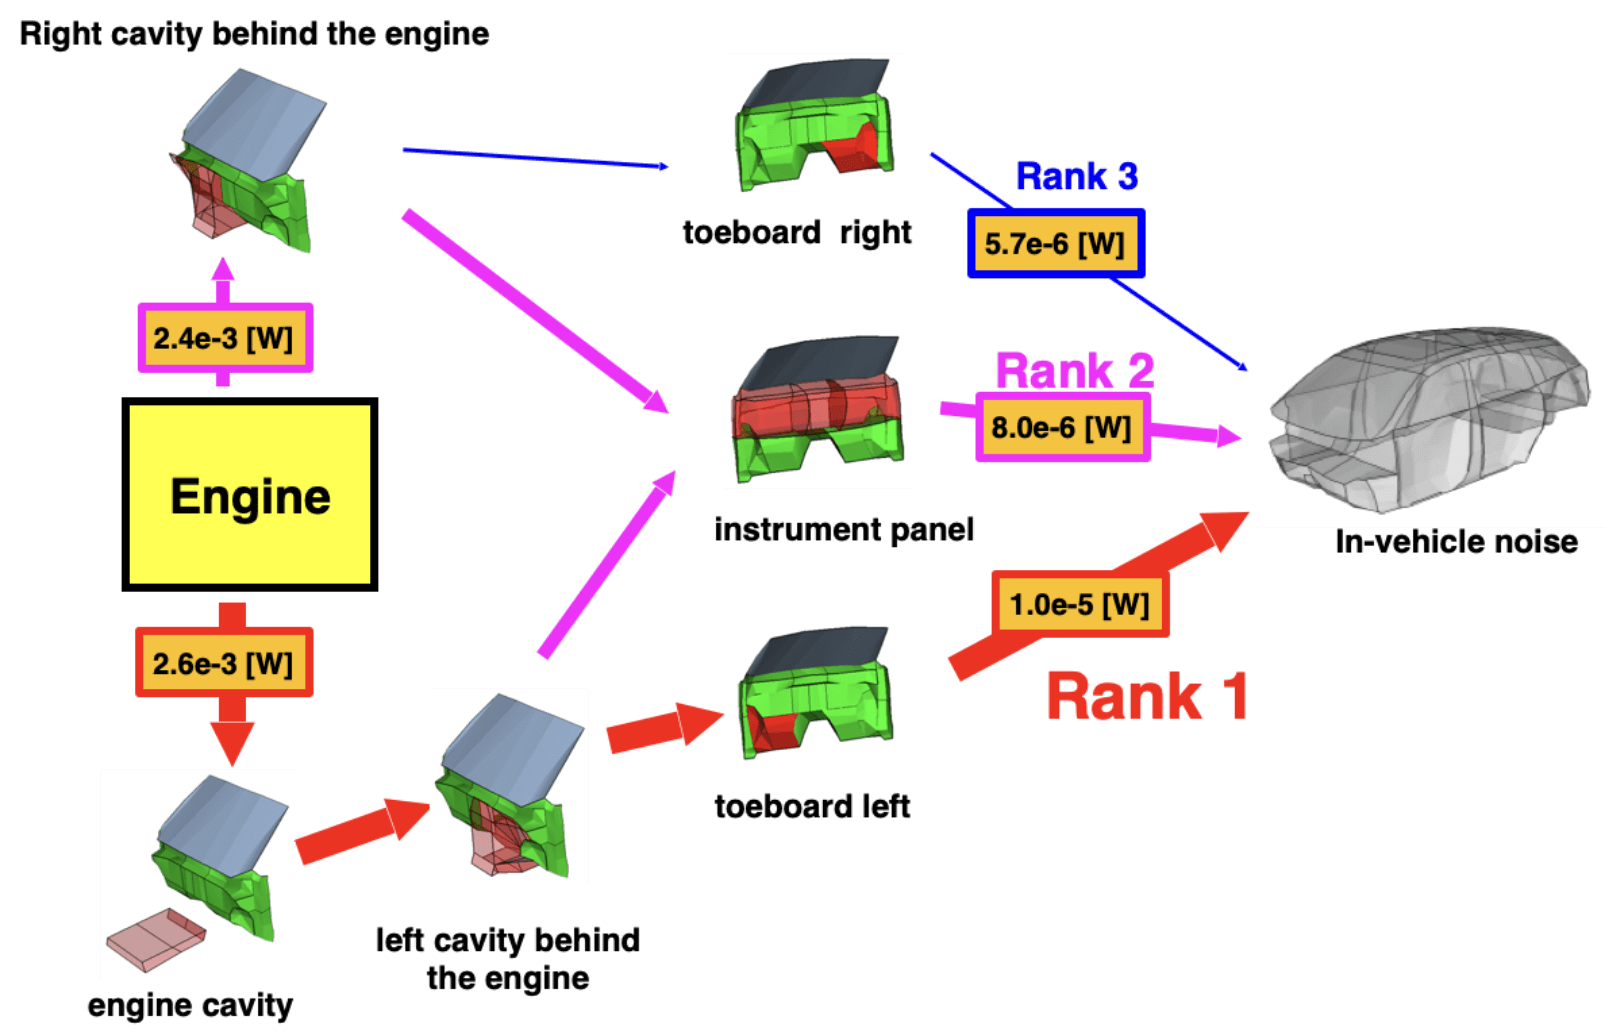
Comparison of Vehicle Performance
ETL comparison
Possible to confirm the difference in performance for each system between vehicles
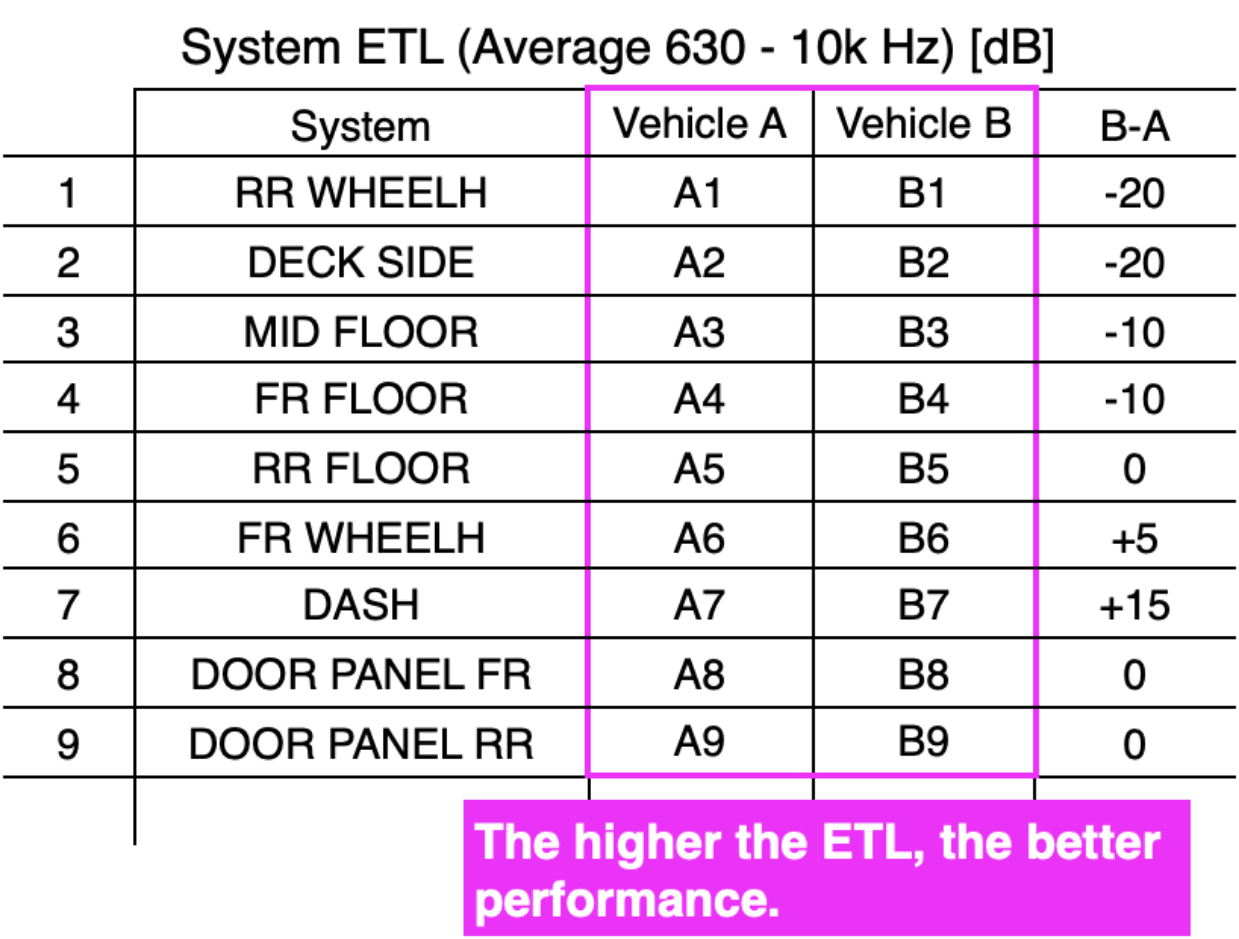
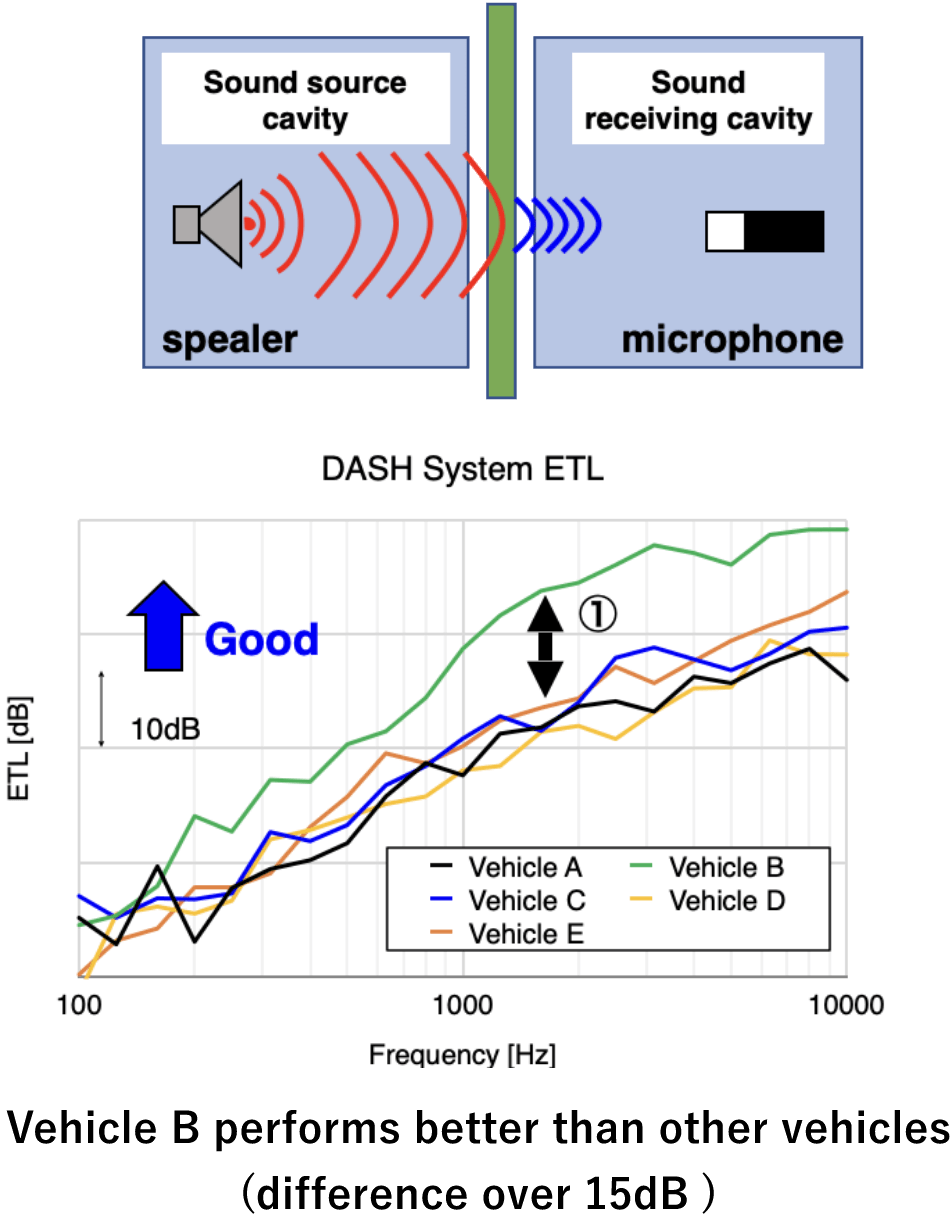
Diagram of ETL
Investigation of specification changes impact
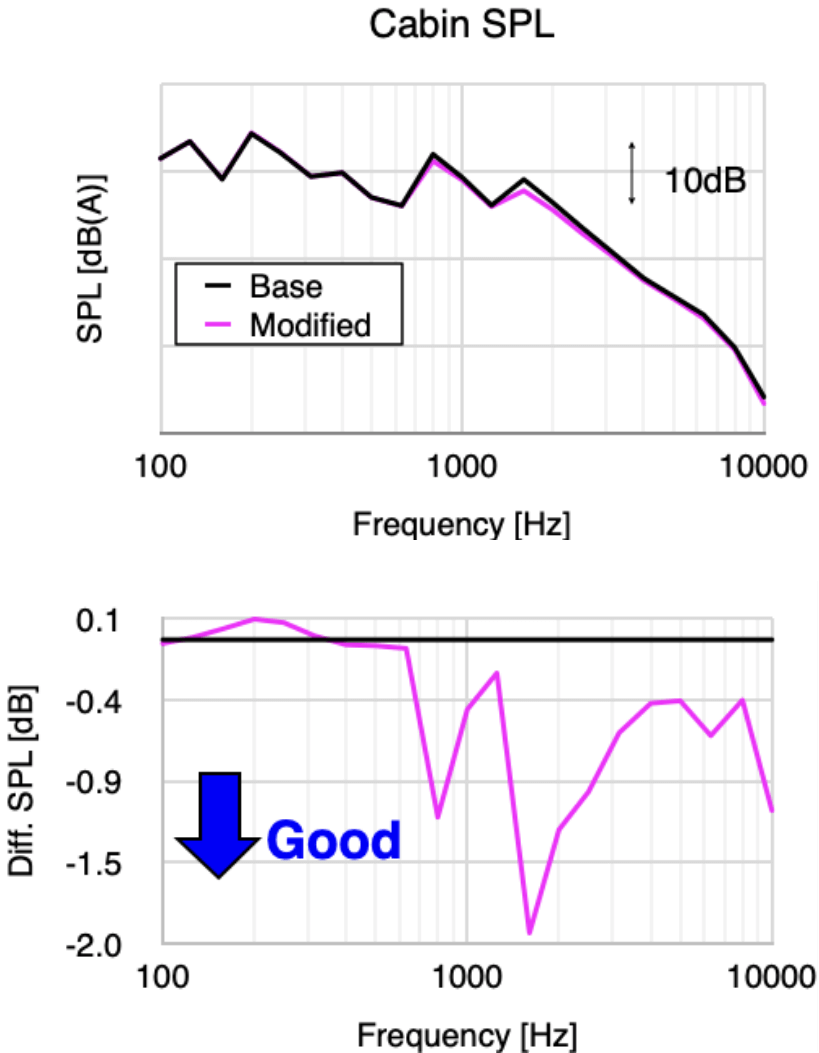
SPL/Contribution/Investigation of ETL changes


Advantages of Using the HSEA Model
- Evaluation is possible without additional experiment, so cost and time can be saved.
- The effect of Specification changes can be evaluated with high accuracy because there are no error factors such as installation defects, which are unavoidable in experiments.
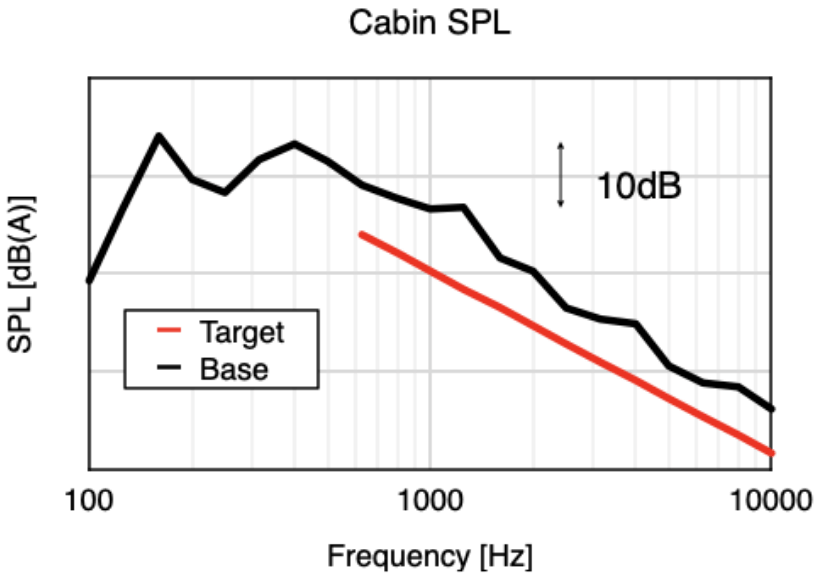
Proposal of specifications to achieve target performance
Target performance can be obtained for the current car in-vehicle sound
The system that needs to be improved and the amplitude of the necessary improvements are automatically calculated
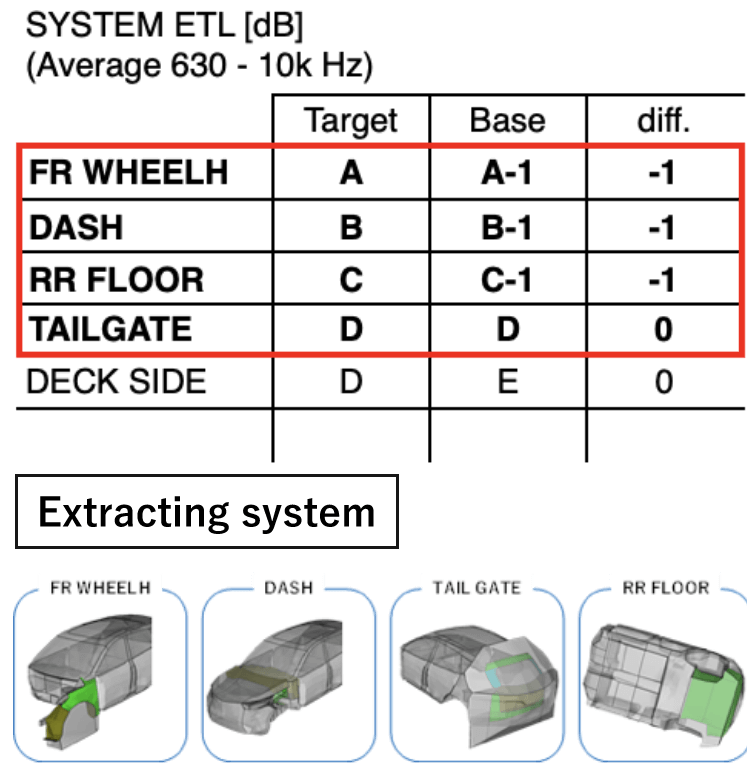
Create soundproof material specifications to achieve target system performance
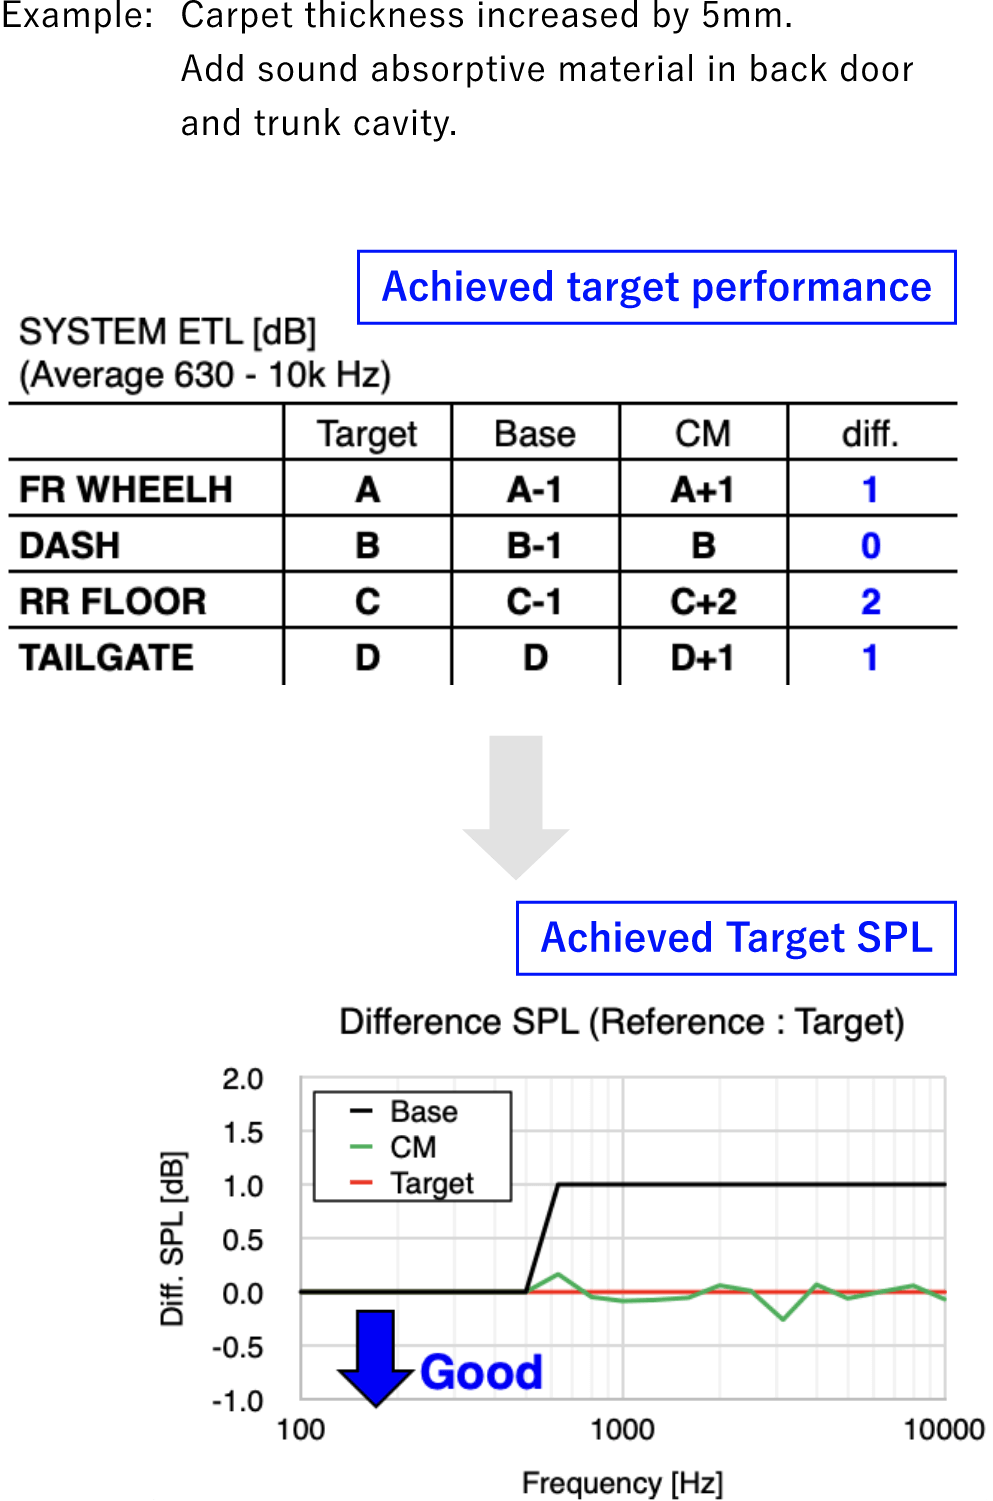
A specification proposal for achieving the target SPL can be prepared in one week
Enables creating of specification proposal at an early stage of vehicle development
List of Analysis Examples
Gear Noise Analysis
Gear noise is an unusual noise that produces a noise at a fixed frequency depending on the speed of the rotation of transmission and other components. The amount of prominent becomes a problem if gear noise is larger than background noise such as road noise.
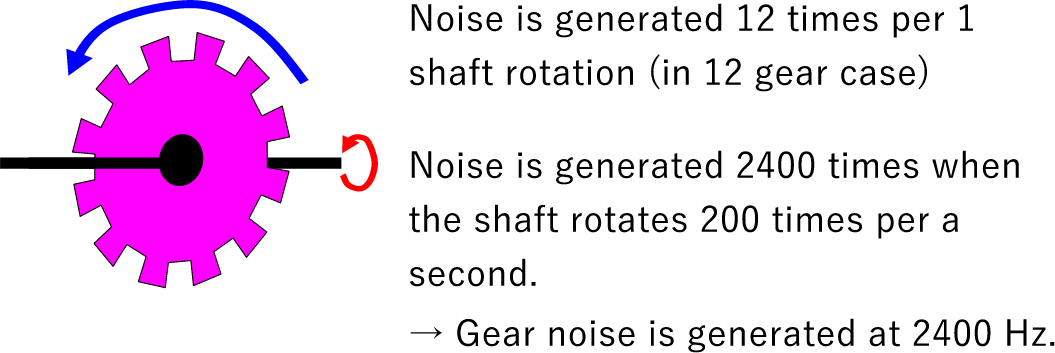

In the HSEA model, it is possible to efficiently reduce only gear noise without changing background noise using contribution and power flow.
Wind Noise Analysis
Wind noise analysis using a wind tunnel
- Acoustic input generated by wind pressure fluctuations
- Vibration input where wind hits the car body
Wind noise contribution can be separated into the two inputs

Change of wind input can be simulated as body shape is changed by collaborating with Computational Fluid Dynamics (CFD).
It will be possible to evaluate the in-vehicle noise.
On-road driving noise analysis
Analysis for inputs when the vehicle is driving on road
- Acoustic input generated by wind pressure fluctuations
- Vibration input where wind hits the vehicle body
- Tire and engine input (other than wind input)
On-road driving nose input=①+②+③

possible to make a more realistic evaluation, including wind noise.
Impact of specification changes can also be investigated
Pedal operation noise analysis
- Example:
- Noise generated when the clutch is stepped
- Left figure:
- Picture of pedal
- Right figure:
- Output contribution during electric seat operation (in 315 Hz)

Noise generated when pedal is stepped can also be analyze by HSEA
Noise source / countermeasure location can be identified
Power Seat Analysis
Noise generated when the electric seat is moved back and forth
- Left figure:
- Photo of electric seat switch
- Right figure:
- Output contribution from dash panel (in 200 Hz)

Noise source / countermeasure location can be identified
Noise source / countermeasure location can be identified
Collaboration of FEM
(Finite Element Method) and HSEA
scroll▶︎
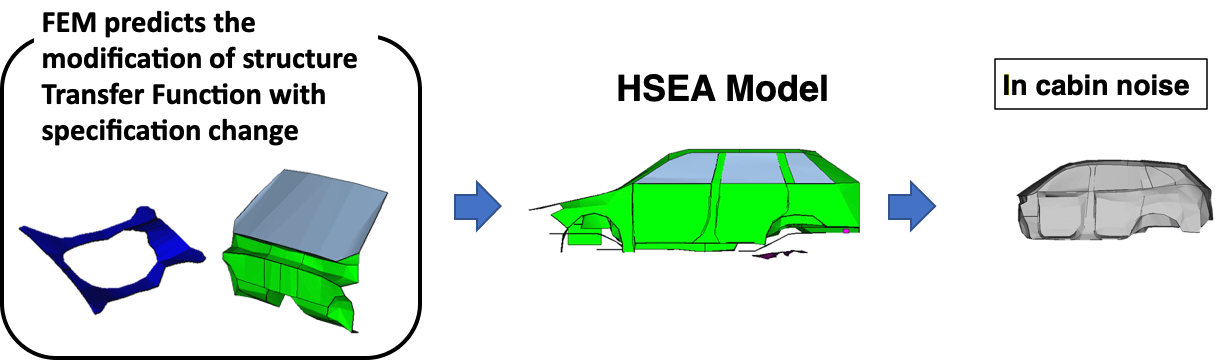
FEM calculations for predicting changes of structure transfer function due to specification changes in structure modification
The change in structure transfer function of the structure modification calculated using FEM (Finite Element Method) is given to the HSEA model to evaluate the effect of the specification change of the structure modification on the noise inside the vehicle.